
For operations and portfolio leaders
Automate monthly reports from your PM tool and spreadsheets
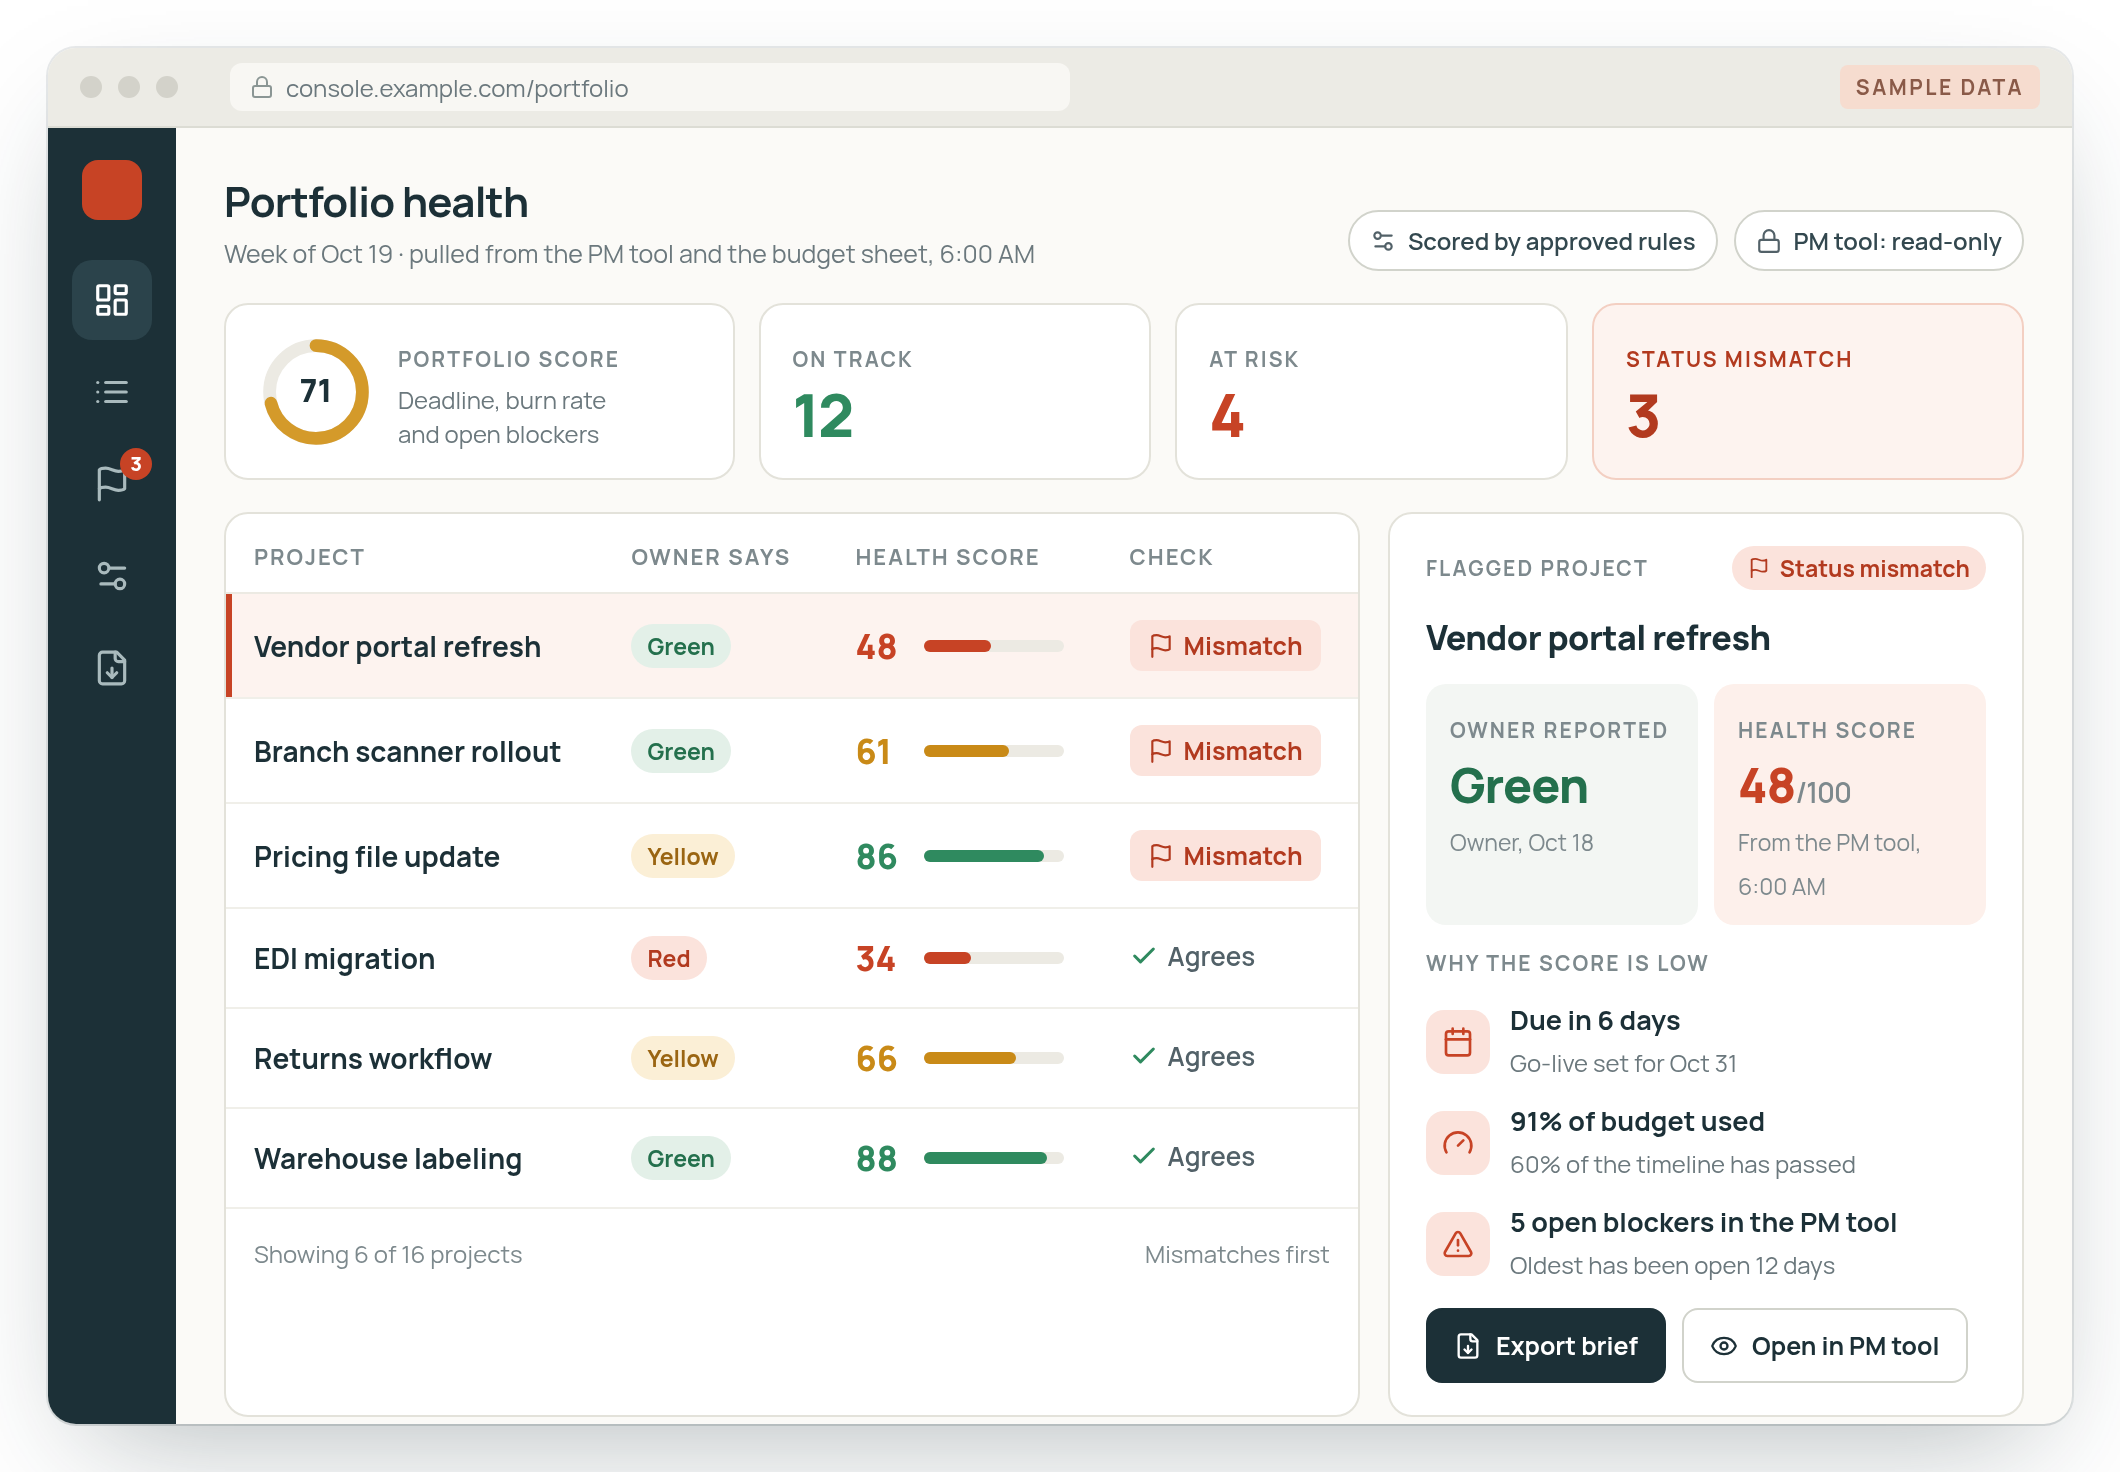
A live dashboard reads your PM tool, spreadsheets and your other systems on a schedule. It scores every project with rules your leaders write down and flags the ones where the owner's status and the data disagree.
- Monthly or weekly leadership reports
- Your PM tool (Jira, Asana, Monday, Smartsheet and others)
- Power BI or a dashboard of your own
Before and after
The same monthly report, two ways
Today the report is only as current as the last person to update a row. The console reads the systems directly.
How it works today
Lagging- Owners update their own rowsin a shared spreadsheet
- Power BI reads that sheetso it is only as new as the last edit
- Each owner picks the colorred, yellow or green
- Leaders get it once a monthafter the numbers have moved
With a live dashboard
Built- Reads the PM tool and the spreadsheetsread-only, on a schedule
- Scores each projectdeadline, budget burn, open blockers
- Flags the disagreementsowner says green, data says otherwise
- Leaders open one live viewor export a short brief
From our calls
Right now his dashboard is only updated on a monthly basis.
It's not a leading indicator. It's a lagging indicator.

Photo: Carlos Muza on Unsplash.
Who this is for
Teams where VPs, analysts or portfolio staff pull numbers out of a PM tool, shared Excel files, payroll and the ERP, then paste them into a report.
Distributors, real estate operators, private equity portfolios and software companies have all brought us this one.
Where the data lives
- Your PM tool
- Excel and SharePoint
- Power BI
- Workday
- Paylocity
- Your ERP
How the live dashboard works
Three steps, your systems
Your systems change the details. The order stays the same.
- 01
Connect, read-only
Your PM tool, shared spreadsheets, payroll or the ERP. Nothing in those systems changes.
- 02
Score with your rules
Leadership writes the rules down, such as deadline, burn rate and open blockers. The report owner signs off before go-live.
- 03
Flag the gaps
When an owner reports green and the data disagrees, both show side by side. Leaders get a live view and a brief they can export.
Built by Tenfold
A national distributor's monthly dashboard, rebuilt from the source
- Before, leadership's dashboard was Power BI over a SharePoint spreadsheet that people filled in by hand, once a month.
- The console reads project data straight from the PM tool with read-only access.
- The health score comes from deadline proximity, burn rate and open blockers. It replaced the color each owner picked.
- Comparing self-reported status with the system data turned up gaps between the two.
- Leaders export a short brief, and the console runs inside the client's own environment.
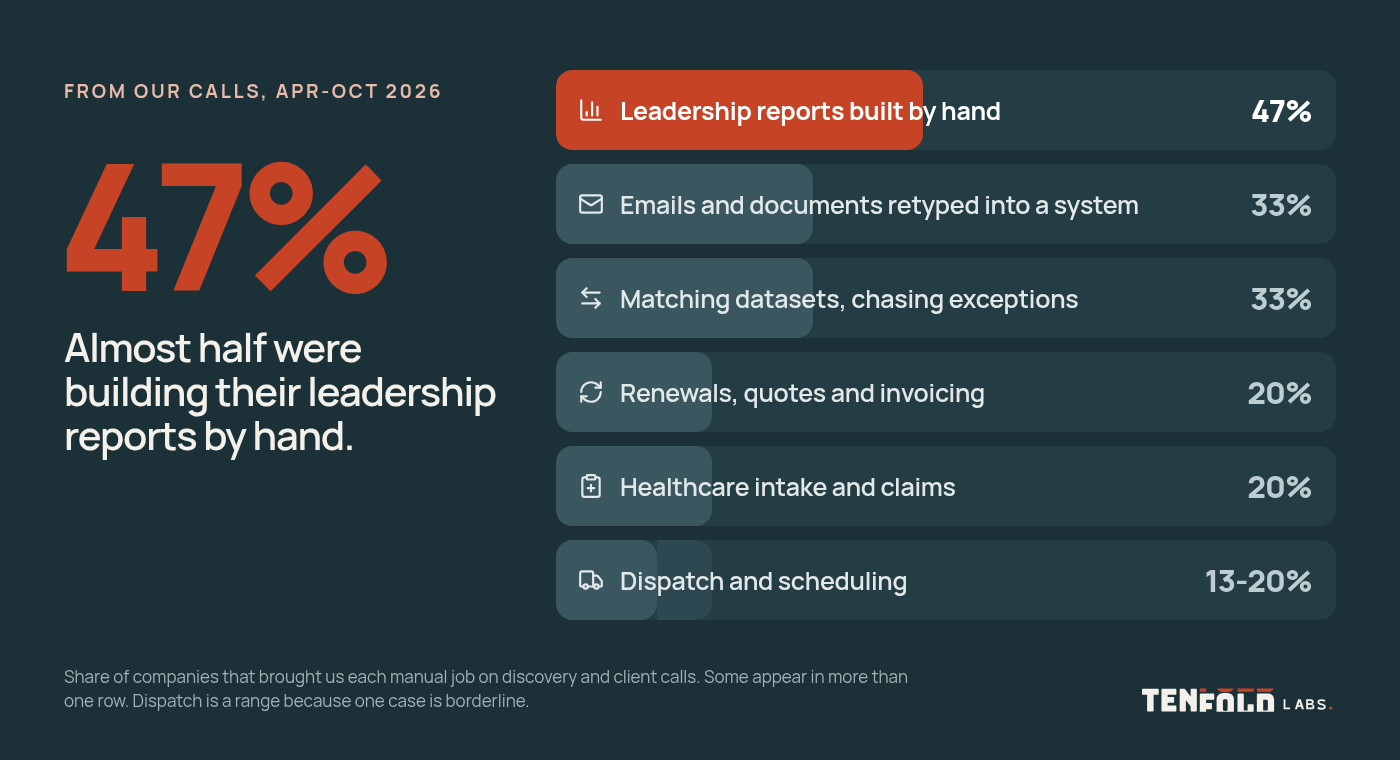
How often companies ask to automate monthly reports
47% of companies on our calls
Leadership reporting was the most common job on our calls. Almost half of the companies described it.
Getting started
What a first version takes
What to bring
- The last two or three versions of the report
- The list of systems the numbers come from
- The person who puts it together today
What you see first
We connect read-only and show you a working dashboard on your own data before a full build. Your staff can run it after that, or we keep adjusting it as new systems come in.
Questions
Common questions
Watch the 36-second version
36 seconds. Narration is a synthetic voice. Screens are samples, not client data.
Do we have to replace Power BI?
No. Tenfold can feed the reporting tool you already use or build the dashboard itself. That gets decided on the first call, based on what your leaders already open.
Does the dashboard need write access to our systems?
No. In the build described on this page, the console reads your PM tool with read-only access. The same approach works for spreadsheets and other systems.
Which systems can it read?
The companies on our calls named their PM tool (Jira, Asana, Monday, Smartsheet and others), shared Excel and SharePoint files, Power BI, Workday, Paylocity and their ERP. Tenfold reviews your list before a build.
Who decides when a project is at risk?
Your leadership does, by writing the rules down. The dashboard applies them the same way to every project, and the person who owns the report can change them.
What happens when an owner's update disagrees with the data?
Both show on the dashboard. Nobody's update is overwritten, and leaders can see where to ask questions.
How do we start?
Use the contact page or email scott@tenfoldlabs.io. Tell us which report your leaders read and which systems feed it.
Tell us which report your leaders wait on
Send us the report and the list of systems behind it. We'll tell you whether a first version on your own data makes sense.
You work directly with Scott Hanson, who scopes the first version with your team and builds it. Based in Austin.
Or email scott@tenfoldlabs.io